Policy Areas
Legislative Agenda
State Budget & Revenue
Economic Well-Being
Direct Cash
Immigration Justice
Criminal Legal Policy
Ballot Measures
Federal Policy
Resources
Blog
Subscribe
About
Jobs
Our Theory of Change
Anti-Racism Commitment
Our Team
Board
Partners
News & Events
In the Media
Donate
Donate
Resources & Tools
Resources & Tools
Filter By:
Types
Brief/Report
Chart/Graphic
Fact Sheet
Video/Webinar
Issues
Capital Gains Tax
Economic Well-Being
Federal Policy
Fines & Fees
Healthy People & Communities
Immigration Justice
State Budget & Revenue
Working Families Tax Credit
Date Range
From
To
Filter
Reset
Video/Webinar
Senate testimony on capital gains
February 2018
Video/Webinar
Senate testimony on tax break transparency and accountability
January 2018
Video/Webinar
Senate testimony on carbon tax bill
January 2018
Fact Sheet
Making Waves: Our Impact in 2017
January 2018
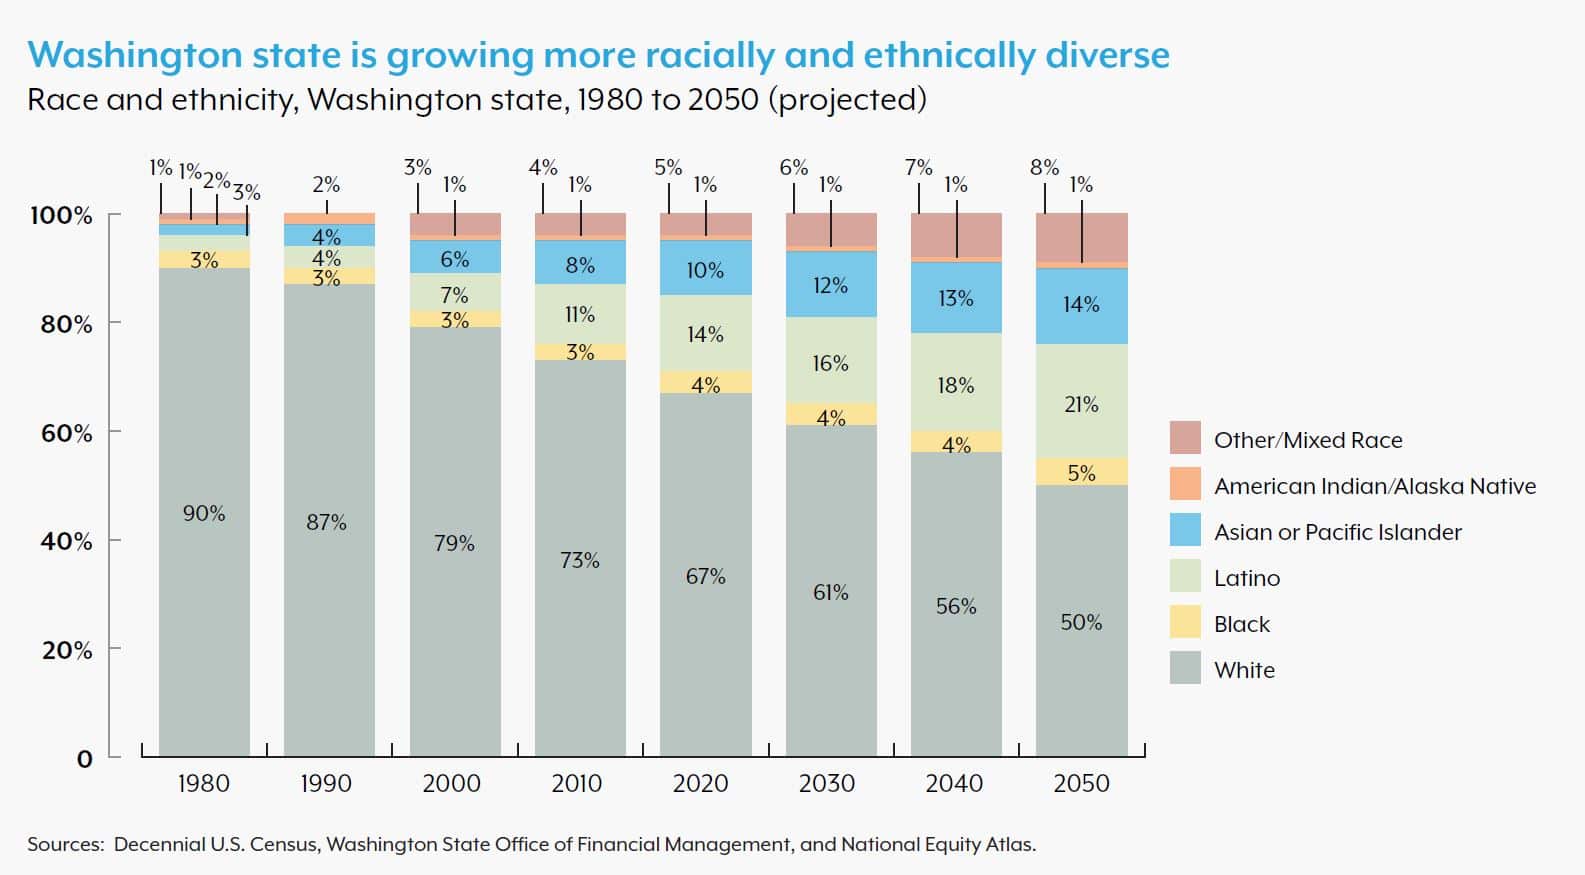
Chart/Graphic
Washington State is Growing More Racially and Ethnically Diverse
December 2017
Brief/Report
Building an Inclusive Economy
December 2017
Fact Sheet
3 Reasons Why the House GOP Tax Plan is Bad for WA
November 2017
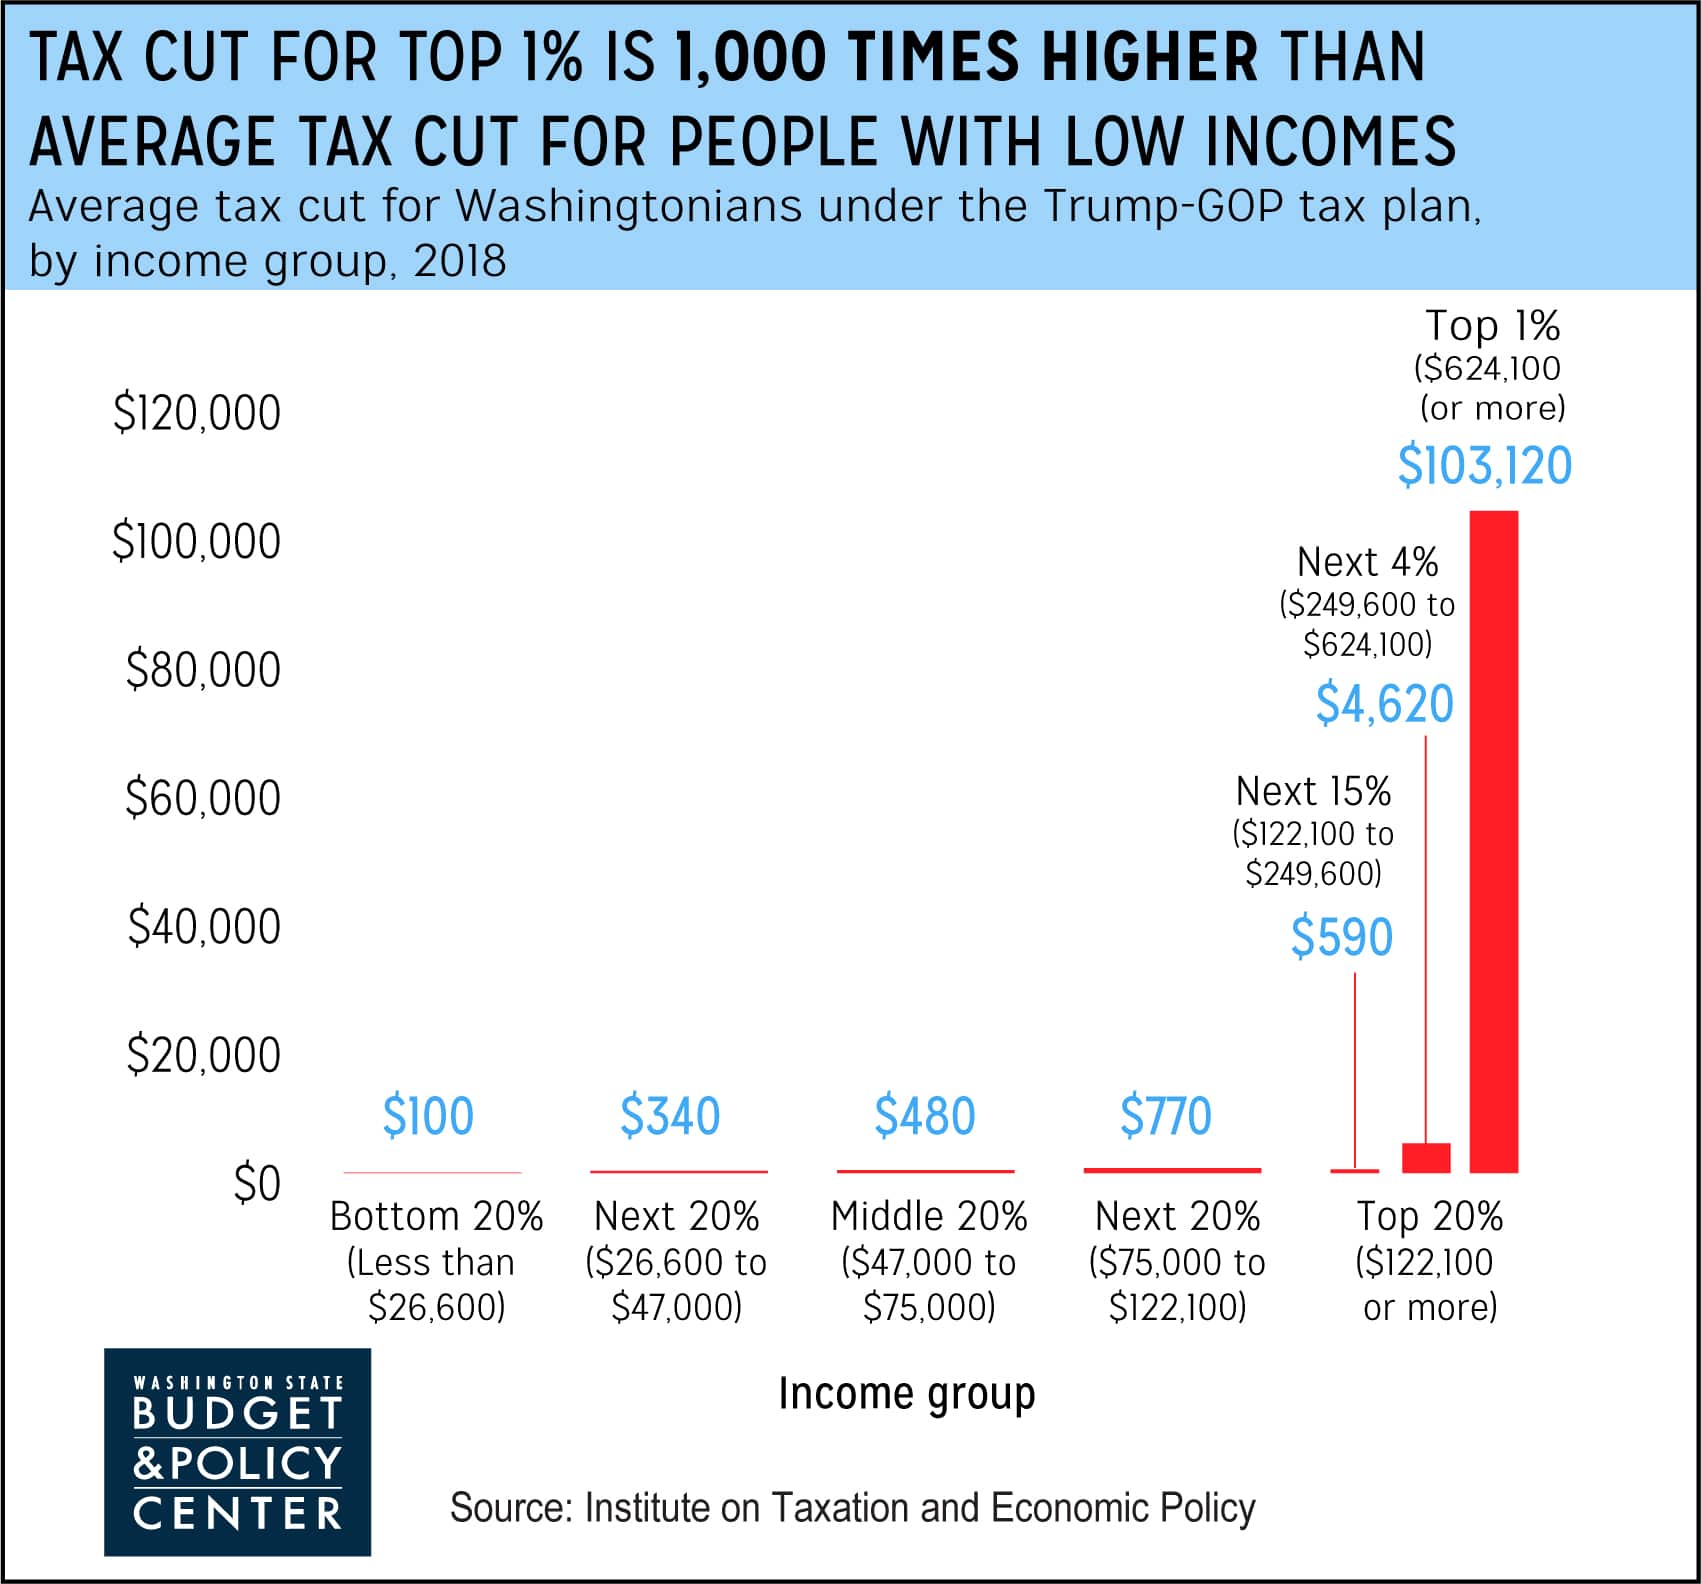
Chart/Graphic
Tax Cut for Top 1% is 1,000 Times Higher Than for Low-Income People
October 2017
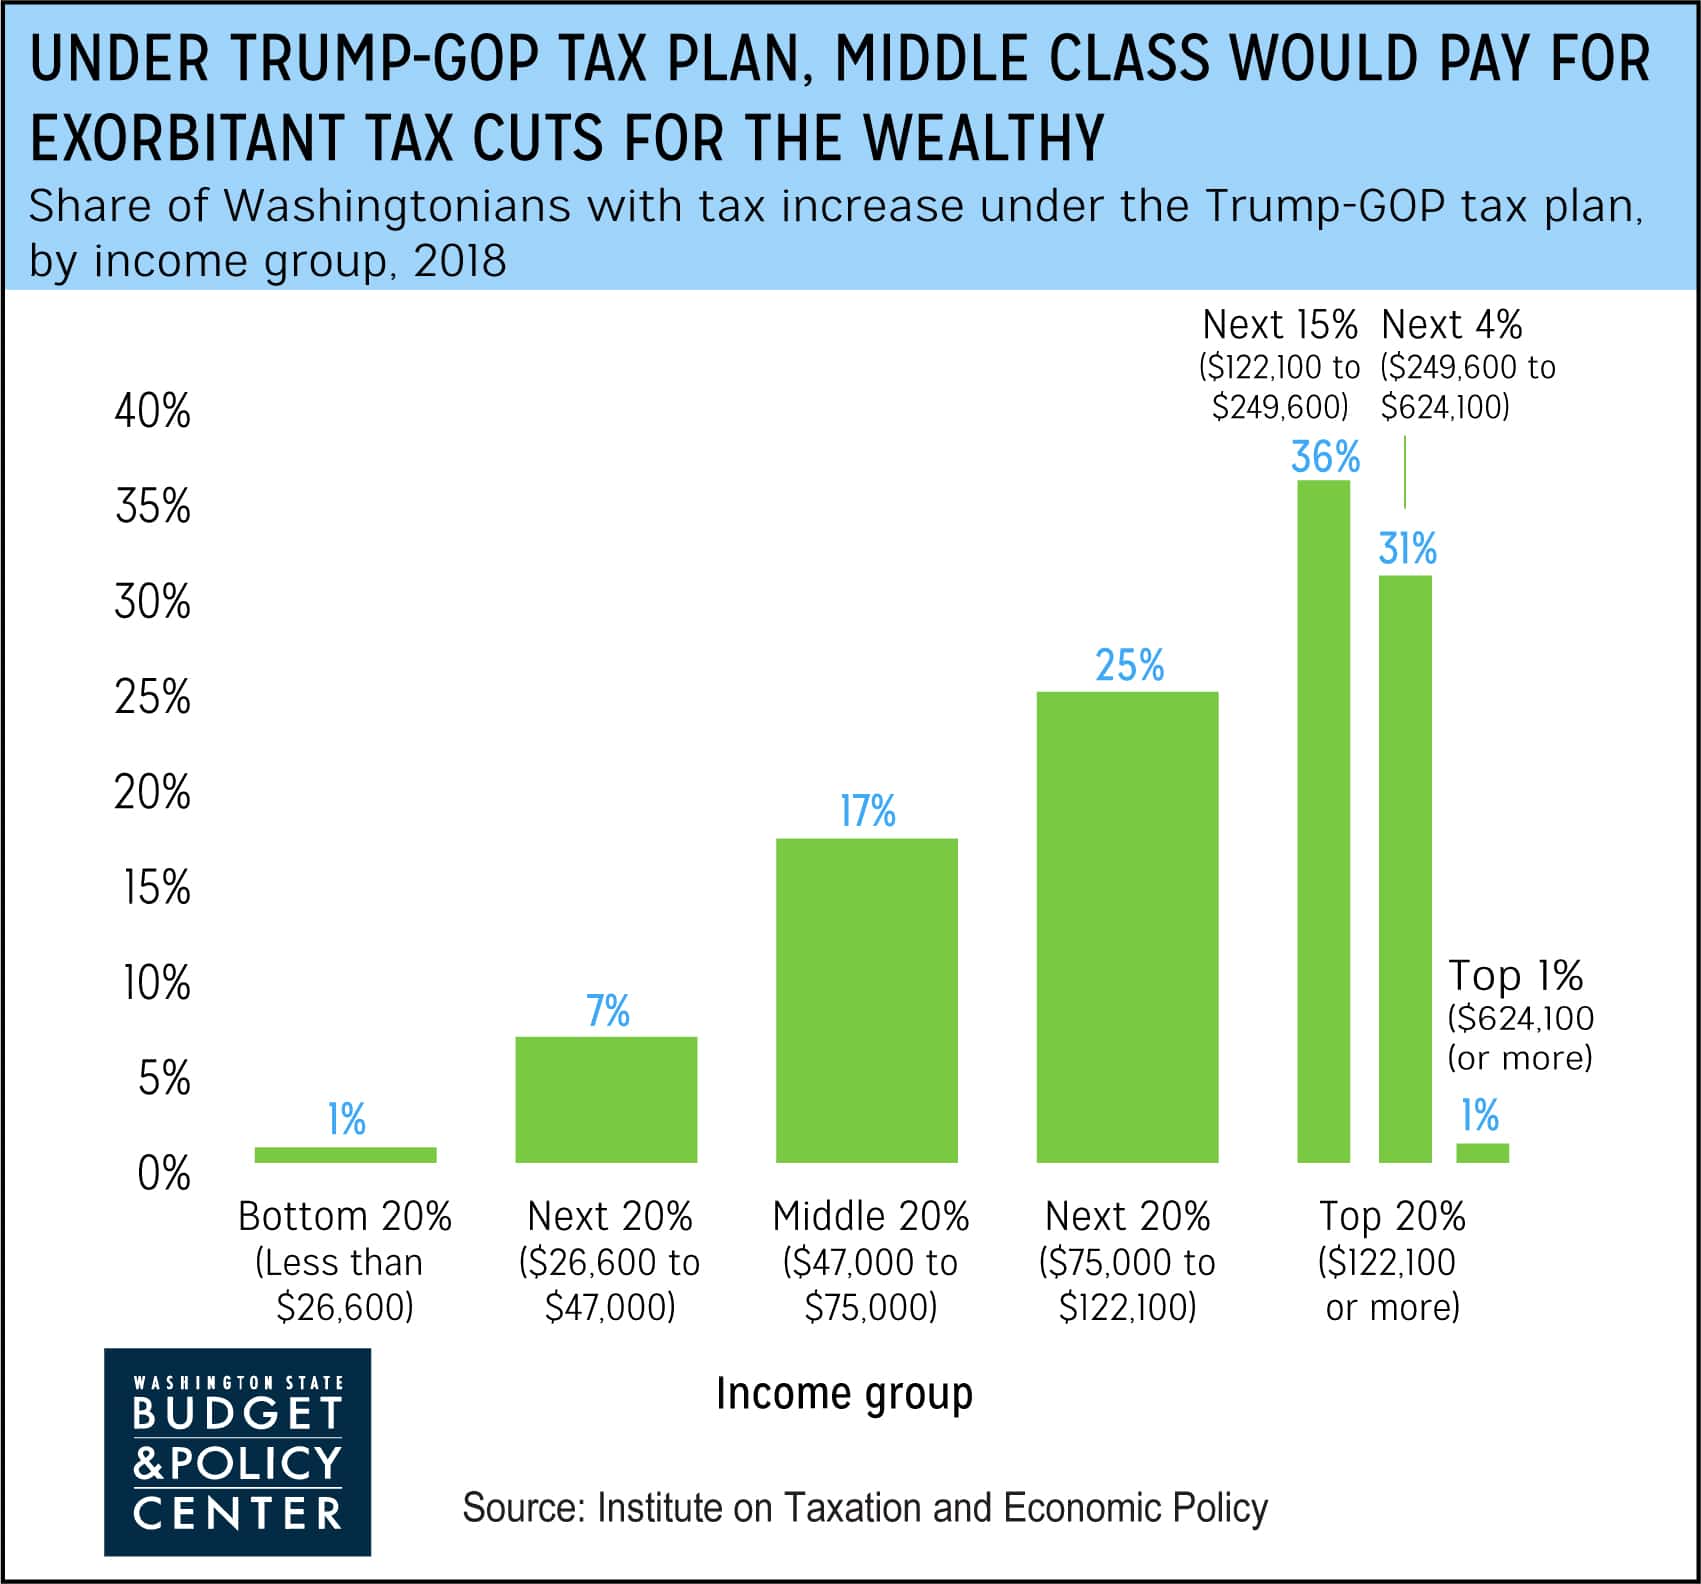
Chart/Graphic
Under Trump-GOP Plan, Middle Class Would Pay for Exorbitant Tax Cuts for the Wealthy
October 2017
<
1
|
…
|
18
|
19
|
20
|
21
|
…
|
29
>
Show:
8
|
24
|
48
results per page